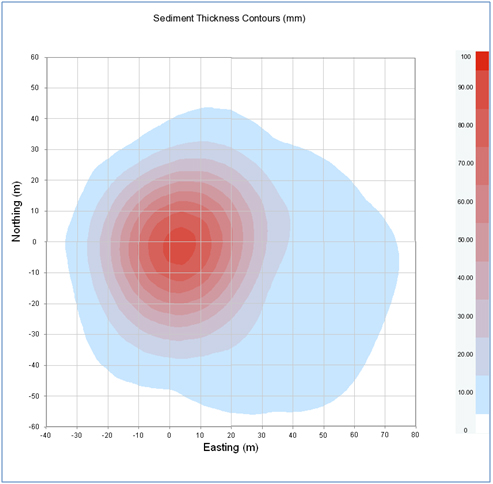
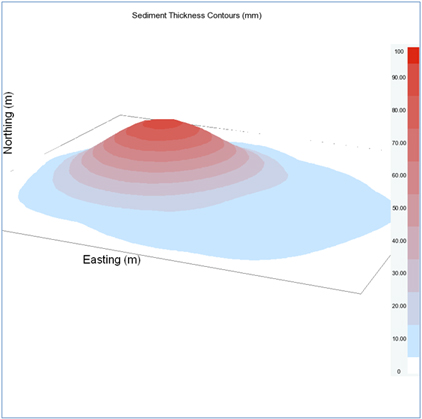
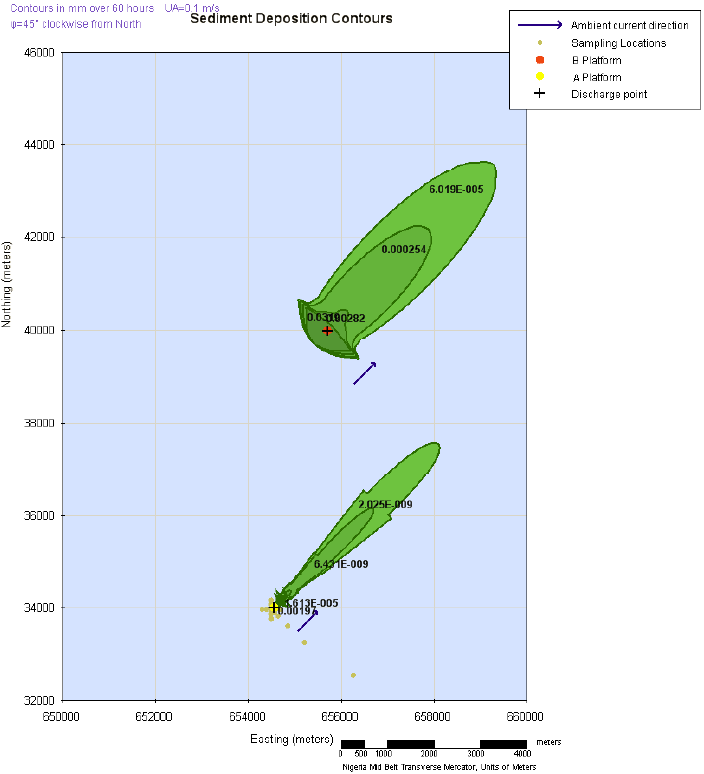
The new CorPlot graphing tool will provide detailed deposition plots based on CORMIX simulation results from a drill cuttings and muds discharge modeling study.
CorPlot provides the following plots and outputs based on the CORMIX simulation:
- Graphical output of suspended sediments in the water column
- Concentration vs. Plume Centerline Downstream Distance
- Concentration vs. Plume Centerline Trajectory
- Dilution vs. Plume Centerline Downstream Distance
- Dilution vs. Plume Centerline Trajectory
- Concentration Isoline plots
- Dilution Isoline plots
- Graphical output of bottom deposition contours
- Depositon plots on user specified grid and coordinate system
- Graphical output of bottom deposition contours on a user specified grid and coordinate system
- Comma separated tabular output file of the sediment deposition/accumulation thickness on the ambient bottom along the plume trajectory
It is often necessary to be able to model varying ambient current directions for offshore drilling operations. This can be achieved using
CorTime.
By combining the capabilities of the CorTime application and the CorPlot, one can
produce an integrated deposition plot over a user specified grid from a drill cuttings and muds discharge modeling study for offshore drilling operations.
Please review the CORMIX Feature Comparison table for CORMIX v12.0 versions,
to check for CorPlot availability - VIEW


